The world of stock market analysis can seem overwhelming at first, filled with charts, numbers, and complex terminology that may leave many investors feeling intimidated. However, understanding the fundamentals of stock market analysis is crucial for anyone looking to navigate the financial landscape and make informed investment decisions. Whether you are a seasoned investor or just starting your journey, mastering this skill can help you uncover hidden opportunities and avoid potential pitfalls.
At its core, stock market analysis involves evaluating financial data and market trends to determine the value of a stock and predict its future movements. By leveraging a combination of technical and fundamental analysis, you can gain insights into a company’s performance and the overall market environment. This guide will break down the essential components of stock market analysis, providing you with the tools and knowledge needed to approach the stock market with confidence and clarity.
Understanding Stock Markets
Stock markets serve as the backbone of the modern financial system, enabling the buying and selling of shares in publicly traded companies. These markets provide a platform for companies to raise capital by offering ownership stakes to investors. In return, investors gain an opportunity to share in the profits and growth of these businesses. A well-functioning stock market is crucial for economic development, as it facilitates investment and liquidity.
Investors analyze stock markets to make informed decisions, weighing various factors that impact stock prices. Market participants include individual investors, institutional investors, and traders who engage in activities based on short-term and long-term strategies. The dynamics of supply and demand influence stock prices, leading to fluctuations driven by market sentiment, economic indicators, and corporate performance. Understanding these principles is essential for anyone looking to navigate the complexities of stock market analysis.
In addition to direct stock trading, stock markets also play a vital role in creating financial products like options and futures, which can be used for hedging or speculative purposes. The interaction between different financial instruments adds layers of complexity, making stock market analysis a multifaceted discipline. By grasping the fundamentals of how stock markets operate, investors can better position themselves to identify opportunities and manage risks effectively.
Key Analysis Techniques
One of the primary techniques in stock market analysis is fundamental analysis. This method involves examining a company’s financial statements, management team, industry position, and economic factors to assess its intrinsic value. Investors use various ratios such as price-to-earnings, debt-to-equity, and return on equity to evaluate a stock’s financial health and potential for growth. By understanding the underlying business, investors can make informed decisions about whether a stock is undervalued or overvalued.
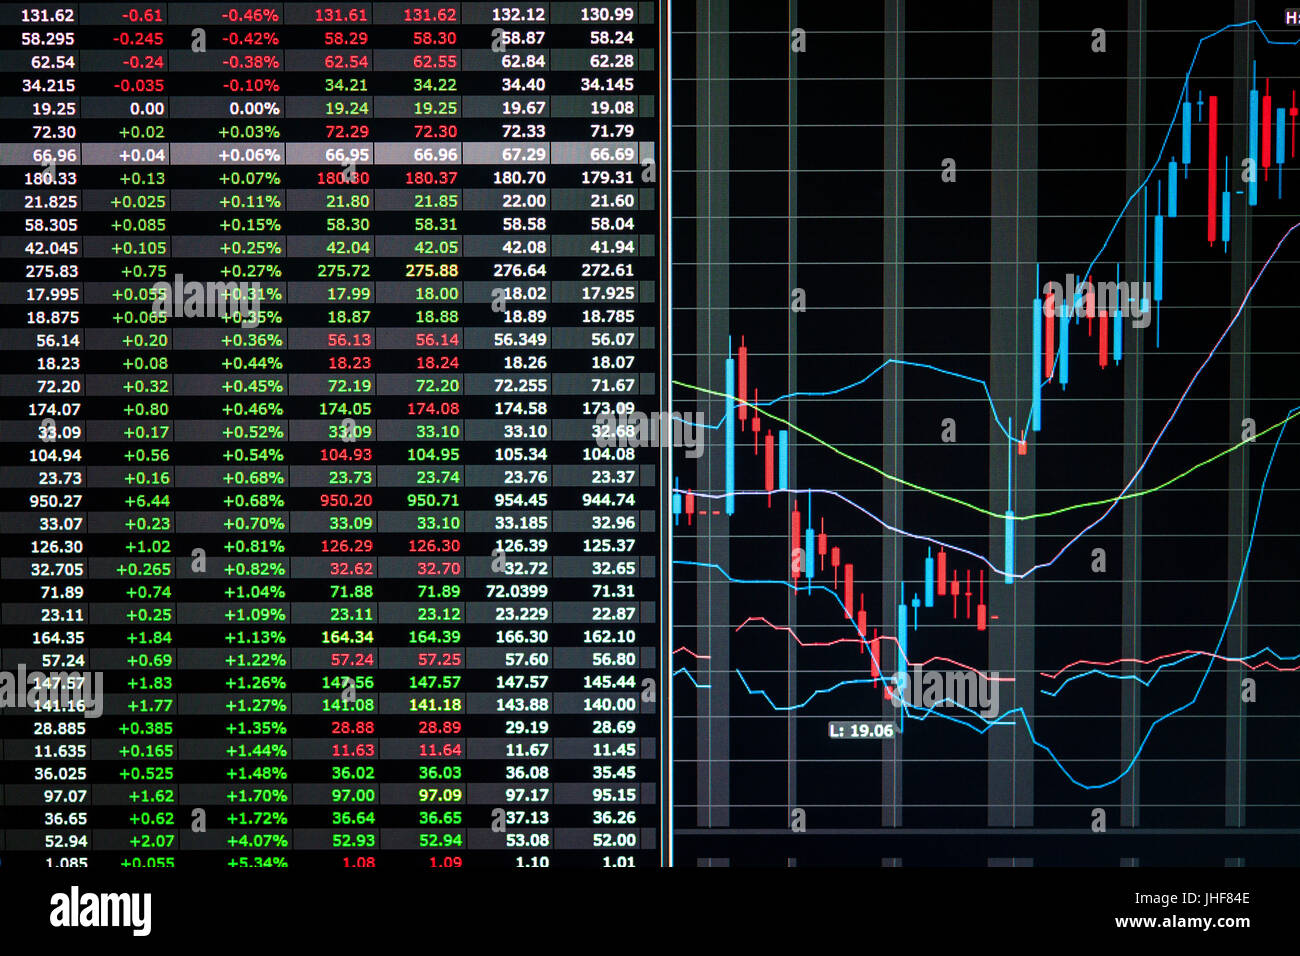
Another important technique is technical analysis, which focuses on analyzing price movements and trading volume through charts and technical indicators. This approach relies on historical price patterns and market trends to predict future price movements. Traders often use tools such as moving averages, Bollinger bands, and the relative strength index to identify entry and exit points in the market. Technical analysis is especially popular among short-term traders who seek to capitalize on market volatility.
Sentiment analysis has also gained prominence in stock market analysis, as it focuses on the overall attitude of investors toward a particular stock or the market as a whole. This technique involves gauging market sentiment through news articles, social media trends, and investor surveys. By understanding how market sentiment can influence stock prices, investors can make strategic decisions based on the collective psychology of the market, tapping into opportunities created by emotional reactions rather than just fundamental or technical factors.
Fundamental vs. Technical Analysis
Fundamental analysis focuses on evaluating a company’s financial health and intrinsic value by examining its economic and financial factors. Investors utilizing this approach look at various elements such as earnings reports, revenue, management quality, market position, and industry conditions. The goal is to determine whether a stock is undervalued or overvalued based on its fundamentals, which can provide insights into its long-term potential. This method is particularly useful for investors seeking to make decisions based on the underlying strength of a business rather than short-term market fluctuations.
On the other hand, technical analysis emphasizes the study of price movements and trading volumes to forecast future price trends. This approach employs various chart patterns, indicators, and historical data, allowing analysts to identify market trends and potential entry and exit points. Technical analysts believe that all available information is already reflected in stock prices, so they focus on price action and market sentiment. This method is often favored by traders looking to capitalize on short-term price movements rather than long-term investments.
Both fundamental and technical analysis serve distinct but complementary purposes in stock market analysis. Fundamental analysis provides a comprehensive understanding of a company’s overall value, which is crucial for long-term investors. In contrast, technical analysis offers tools and strategies for traders aiming to maximize short-term gains. By combining insights from both analyses, investors can enhance their decision-making process and potentially achieve better financial outcomes in the stock market.
Interpreting Market Indicators
Market indicators are essential tools for investors seeking to understand the ebb and flow of stock prices. These indicators can provide insights into market trends and potential future movements. Key indicators such as moving averages, relative strength index, and trading volume can help analysts identify whether a stock is overbought or oversold. By examining these metrics, investors can make more informed decisions about when to enter or exit positions in the market.
Another important aspect of interpreting market indicators is understanding the broader economic context. Indicators often reflect underlying economic conditions, such as interest rates, inflation, and employment data. For instance, an increase in employment might lead to higher consumer spending, which could positively affect stock prices. Conversely, rising interest rates can dampen market enthusiasm as borrowing costs increase. Therefore, keeping an eye on economic reports and broader market trends is crucial for successful stock market analysis.
Finally, sentiment indicators can also play a critical role in understanding market dynamics. These measures gauge the mood of investors and can help predict short-term price movements. For example, extreme bullish or bearish sentiment can signal potential reversals, as markets tend to correct when they become too one-sided. Incorporating sentiment analysis alongside traditional indicators allows investors to develop a more comprehensive view of market conditions, thus enhancing their overall stock market analysis strategy.
Developing a Trading Strategy
Trading Forecast
Creating a successful trading strategy begins with setting clear goals. Traders must determine their risk tolerance, investment horizon, and desired returns. This foundational step helps in shaping the overall approach to stock market analysis, guiding decisions on which securities to trade and when to enter or exit the market. A well-defined objective provides a framework to evaluate potential trades and maintain discipline during market fluctuations.
Once goals are established, traders should incorporate both fundamental and technical analysis into their strategy. Fundamental analysis involves examining a company’s financial health, market position, and economic factors that may influence its stock price. Technical analysis focuses on historical price movements and trading volumes, using charts and indicators to identify trends and potential entry and exit points. By blending these analyses, traders can gain a comprehensive understanding of market conditions and make informed decisions.
Finally, backtesting the strategy on historical data is crucial to assess its effectiveness. This involves applying the trading strategy to past market conditions to see how it would have performed. Adjustments can be made based on the results, allowing traders to refine their approach before committing capital in the live market. Consistent review and adaptation of the trading strategy based on ongoing performance and changing market dynamics is essential for long-term success in stock market analysis.


